Thursday 31 January 2008

Geoquery 2008 v0.71 (oops)

Geoquery 0.7 has been quickly updated to 0.71 to fix the bug from yesterday.

It was while I was describing the problem that I was reminded how confusing it is for users when something "fails silently".

Imagine if the a "File-Save" function didn't report an error when your latest masterpiece couldn't be saved... you'd close the application and expect the data to be available next time - but it would be gone... forever! I strongly discourage rampant use of try{}catch{} in C# because it often (inadvertently) leads to silent failures.

By drawing the polygons on the Map & Sphere, but drawing them incorrectly, Geoquery was giving the impression that it was working when it wasn't. OK, probably not as severe as losing a file, but confusing nevertheless. It seemed important enough to fix and update (even though just a day earlier I'd decided it was "good enough for now").

So now the polygons are drawn correctly, and when they can't be (across +/-180° longitude), it "fails loudly" :)
SELECT geography::STGeomFromText(
'POLYGON((-33.9 151.12, 0 -118.4, 33.8 -118.4,-33.9 151.12))', 4326
), 'Red' as color, '#33ff0000' as Fill


P.S. a couple of other issues were also fixed, thanks Morten!

Wednesday 30 January 2008

Geoquery 2008 beta - polygons on sphere NOT!

The releast notes for the latest Geoquery beta release should state in BIG BOLD LETTERS that the POLYGON GEOGRAPHY is not correctly rendered. I knew this but rushed the release out regardless - but this MSDN Forums post reminded me how confusing this can be so I wanted to be sure people use LINESTRING for now.

To illustrate, the poster wants to know why these polygons don't BOTH STIntersect 'Vancouver'...
DECLARE @myPoint geography, @polySmall geography, @polyBIG geography
SET @myPoint = geography::Parse('POINT(49.274138 -123.098562)')
SET @polySmall = geography::Parse('POLYGON((47.0 -124.0, 47.0 -122.0, 50.0 -122.0, 50.0 -124.0, 47.0 -124.0))')
SET @polyBIG = geography::Parse('POLYGON((47.0 -155.0, 47.0 -85.0, 50.0 -85.0, 50.0 -155.0, 47.0 -155.0))')
SELECT @polySmall.STIntersects(@myPoint) AS Intersect_polySmall, @polyBIG.STIntersects(@myPoint) AS Intersect_polyBIG
SELECT @polyBIG , 'Red' as Color, '#44ff0000' as fill
SELECT @polySmall, 'Green' as Color, '#4400ff00' as fill
SELECT @myPoint, 'Blue' as Color, 2 as Thickness
because he's visualizing the shapes looking like this:

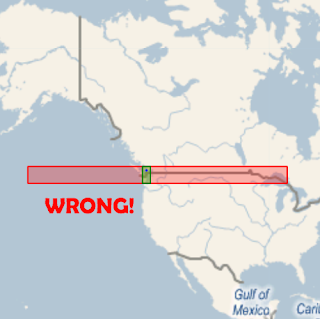
This is WRONG WRONG WRONG because Geoquery is not correctly rendering POLYGONs on the curvature of the Earth's surface... so you THINK they should intersect, but STIntersects() correctly returns false.

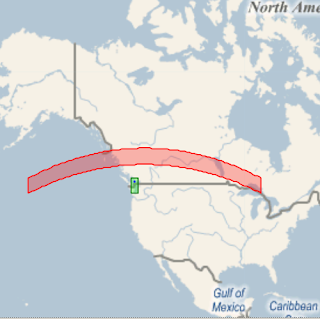
If we use LINESTRINGs to do the drawing (which Geoquery 2008 v0.7 DOES support) then it's rendered correctly and you can see that they don't overlap:
/* However converting to a LINESTRING which is rendered correctly, it's clear they don't intersect*/
DECLARE @myPoint geography, @polySmall geography, @polyBIG geography
SET @myPoint = geography::Parse('POINT(49.274138 -123.098562)')
SET @polySmall = geography::Parse('LINESTRING(47.0 -124.0, 47.0 -122.0, 50.0 -122.0, 50.0 -124.0, 47.0 -124.0)')
SET @polyBIG = geography::Parse('LINESTRING(47.0 -155.0, 47.0 -85.0, 50.0 -85.0, 50.0 -155.0, 47.0 -155.0)')
SELECT @polySmall, 'Green' as Color, '#4400ff00' as fill
SELECT @polyBIG, 'Red' as Color, '#44ff0000' as fill
SELECT @myPoint, 'Blue' as Color, 2 as Thickness


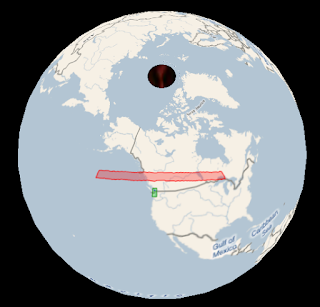
Even more interesting - the lines that should be parallel ARE, and the lines that shouldn't be (longitude) AREN'T, when drawn on a globe (as they should be).


p.s. if you're wondering why LINESTRING works and POLYGON doesn't; it was (fairly) trivial to handle lines that 'break' over the +/-180 longitude (~international date line), but less so to 'split' POLYGONs into parts to draw independently ... so I left it out (for now). Sorry 'bout that.

UPDATE 31-Jan: this has been fixed and Geoquery 2008 v0.71 is available for download

Tuesday 29 January 2008

Geoquery 2008 v0.7 (beta) available for "testing"

The latest version of Geoquery, v0.7, is available for download. Unfortunately it was a bit of a rush to get it out, so I haven't updated all the instructions - hopefully you'll get the hang of it.

Obligatory screenshot:

Monday 28 January 2008

STIntersects=true; STIntersection=null ??

Not really sure whether this is a 'bug' or me not just 'getting' the single-hemisphere restriction, but sometimes when STIntersects returns true, STIntersection returns null.

I first noticed it when 'drawing' LINESTRINGs across the 'international date line' (longitude=180) which is where the default map edges are -- the "line" from Sydney to Los Angeles necessarily crosses this boundary.
DECLARE @idl geography
DECLARE @idlSouth geography
DECLARE @SYDtoEquator geography
DECLARE @SYDtoLAX geography

SET @idl = geography::STGeomFromText('LINESTRING(85 180, -85 180)',4326);
SET @idlSouth = geography::STGeomFromText('LINESTRING(0 180, -85 180)',4326);
SET @SYDtoEquator = geography::STGeomFromText('LINESTRING(-33.9 151.12, 0 -118.4)', 4326);
SET @SYDtoLAX = geography::STGeomFromText('LINESTRING(-33.9 151.12, 33.8 -118.4)', 4326);

SELECT @SYDtoEquator.STIntersects(@idl) as [Intersects]
, @SYDtoEquator.STIntersection(@idl) as [Intersection]
, @SYDtoEquator, 'Sydney to Equator' as [Desc]
, 'why is Intersection null?' as [Question]
SELECT @SYDtoLAX.STIntersects(@idl) as [Intersects]
, @SYDtoLAX.STIntersection(@idl) as [Intersection]
, @SYDtoLAX , 'Sydney to LAX' as [Desc]
/* shortening the 'idl' line 'fixes' it */
SELECT @SYDtoEquator.STIntersects(@idlSouth) as [Intersects]
, @SYDtoEquator.STIntersection(@idlSouth ) as [Intersection]
, @SYDtoEquator, 'Sydney to Equator' as [Desc]
SELECT @SYDtoLAX.STIntersects(@idlSouth) as [Intersects]
, @SYDtoLAX.STIntersection(@idlSouth) as [Intersection]
, @SYDtoLAX, 'Sydney to LAX' as [Desc]
This is the result "set"


And this is how the lines "should look"


As the line endpoint changes, so does the STIntersection result (although STIntersects returns true every time)
@SYDtoEquator = geography::STGeomFromText
('LINESTRING(-33.9 151.12, 10 -118.4)', 4326); -- NULL
@SYDtoEquator = geography::STGeomFromText
('LINESTRING(-33.9 151.12, 20 -118.4)', 4326); -- NULL
@SYDtoEquator = geography::STGeomFromText
('LINESTRING(-33.9 151.12, 30 -118.4)', 4326); -- GOOD
@SYDtoEquator = geography::STGeomFromText
('LINESTRING(-33.9 151.12, 40 -118.4)', 4326); -- GOOD
@SYDtoEquator = geography::STGeomFromText
('LINESTRING(-33.9 151.12, 50 -118.4)', 4326); -- NULL

So... any thoughts why some of these 'succeed' while others fail?

Thursday 24 January 2008

Spatial queries: not just for Earth

No idea what real applications this might have, but it was kinda fun:
/* http://www.fi.edu/pieces/schutte/landchart.html */
select -- Apollo landings
geography::STGeomFromText('POINT(0.67 23.49)', 4326)--1
, geography::STGeomFromText('POINT(-2.94 -23.45)', 4326)--2
, geography::STGeomFromText('POINT(-3.67 -17.46)', 4326)--14
, geography::STGeomFromText('POINT(26.11 3.66)', 4326)--15
, geography::STGeomFromText('POINT(-8.6 15.31)', 4326)--16
, geography::STGeomFromText('POINT(20.17 30.8)', 4326)--17
, 15.0 AS [Thickness], '#770000ff' AS [Color]


The map data in Geoquery is in a configurable Xml file - MapSources.xml so it's relatively simple to include different tile servers for Earth images (as well as the Moon & Mars)!

Friday 18 January 2008

geography:STBuffer() IS 'straight'

It can be difficult to visualize "geographic" straight lines (intersections, overlaps, etc) on a 'flat' projection, so here's a set of STBuffers over the LAX-JFK line... it doesn't "look" straight until you see it on a globe:


Using the 'special columns' feature of Geoquery (and a different map...)
DECLARE @g GEOGRAPHY
SET @g = geography::STGeomFromText('LINESTRING(33 -118, 40 -73)', 4326);
SELECT @g, 'Blue' AS [COLOR], 2 AS [Thickness]
UNION ALL SELECT @g.STBuffer(450000), 'Blue' as [COLOR], 1 AS [Thickness]
UNION ALL SELECT @g.STBuffer(1500000), 'Green' as [COLOR], 1 AS [Thickness]
UNION ALL SELECT @g.STBuffer(3000000), 'Purple' as [COLOR], 1 AS [Thickness]
UNION ALL SELECT @g.STBuffer(4000000), 'Orange' as [COLOR], 1 AS [Thickness]

Thursday 17 January 2008

Geoquery: when a straight line isn't straight...

I was already aware that straight lines on a sphere (aren't really straight), but had left the correct handling of such matters out of Geoquery 0.6.

Unfortunately, this made it look rather incomplete; simply drawing a straight line over a projected map...

...isn't quite right

There are quite a few references for how to calculate the 'correct line' - I liked Ed Williams Aviation Formulary - and finally got around to giving it a try.

Here is how the query (and result) should look; with a couple of extra STBuffers thrown in...
DECLARE @g geography;
-- LAX 33°57 -118°24
-- JFK 40°38 -73°47

SET @g = geography::STGeomFromText(
'LINESTRING(33 -118, 40 -73)', 4326);
SELECT @g, null,null,null, 'Blue' as [COLOR]
UNION ALL
SELECT @g.STBuffer(450000), @g.STBuffer(1500000), @g.STBuffer(3000000), @g.STBuffer(4000000), 'Orange' as [COLOR]


The interesting thing about this canvas is the 'straight line' was the only element that I needed to programmatically 'project' -- Katmai's spatial support in the GEOGRAPHY::STBuffer() result is already a POLYGON whose points can be applied directly to the map-projection (ie. it isn't just described as two semicircular shapes joined by two parallel straight lines).

Geoquery can also correctly show buffers on points [aren't] circular on a projected map; the query from that link is reproduced below

DECLARE @g geography;
-- Copenhagen 55°37 12°39
SET @g = geography::STGeomFromText('POINT(55.55 12.66)', 4326);
SELECT @g, 'Blue' as [COLOR]
UNION ALL
SELECT @g.STBuffer(4000000), 'Purple' as [COLOR]


NOTE: Geoquery 2008 0.7 (which contains the enhancements described above) is NOT YET AVAILABLE for download. When it is available, it will also include the complete set of GEOGRAPHY Examples in addition to the GEOMETRY ones already available.

Wednesday 16 January 2008

Geoquery 2008 v0.6 (beta)

Geoquery 2008 now supports the GEOGRAPHY datatype as well - displaying the results on a Virtual Earth map rather than a white shape canvas.


v0.6 also adds an Export... function so you can save spatial query results graphically, for emailing/reports/etc.


Here are a couple of Exported resultsets from the MSDN Sample queries...

Wednesday 9 January 2008

Geoquery: Geography MkII

Just displaying a series of points doesn't look like much


but it can be the foundation of some neat spatial reporting - this query (attempts to) show the density of votes by postcode.

select p.postcode, p.location,
CASE
WHEN p.Postcode < 2000 THEN '#44ff0000'
WHEN p.Postcode < 3000 THEN '#4400ff00'
WHEN p.Postcode < 4000 THEN '#440000ff'
WHEN p.Postcode < 5000 THEN '#44880088'
WHEN p.Postcode < 7000 THEN '#44FFFF00'
END AS [Color]
, CASE WHEN Totalvotes < 1000 THEN 1
WHEN Totalvotes < 2000 THEN 2
WHEN Totalvotes < 3000 THEN 3
WHEN Totalvotes < 4000 THEN 4
WHEN Totalvotes < 5000 THEN 5
ELSE 6 END AS [Thickness]
from Postcodes P
INNER JOIN PollingPlaces pp ON pp.Postcode = p.Postcode
INNER JOIN PollingPlaceVotes ppv ON ppv.PollingPlaceID = pp.PollingPlaceID


Note the status bar - that's 56,951 rows!! Try loading those points into Virtual Earth! :-)

Sunday 6 January 2008

Geoquery is learning maps


Turns out basic 'map' support was pretty easy (although it's not quite done and available for download just yet...)

This article came in handy - Virtual Earth Tile System - I'd previously used it as a reference for SilverlightEarth.com, although I had to convert it to jscript for that.