Having read (and tried out) John's first impression of SQL 2008 Spatial, I went about extending the dataset to try some of the other capabilities of SQL Server 2008's geography datatypes and functions.
The following tables were added:
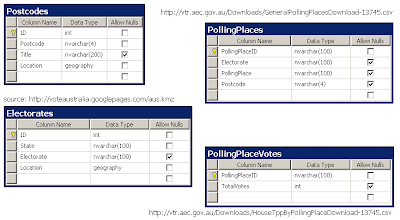
and the data inserted. The KMZ file was parsed with the XSD generator and C# (similar to John's example);

the CSV files were opened in Excel

and INSERT statements generated.

It's worthwhile noting that the data import didn't go 100% according to plan. Some electorates consist of more than one polygon (to be unioned together, I suppose) - I've only imported the first Polygon for each electorate in the KMZ file. Other electorates failed with SQL errors - still to determine why the coordinates listed cause SQL Server to fail (no, it's not the ring-orientation...).
The following queries were then possible...
select state
 ,   electorate
 ,   ROUND(Location.STArea()/1000000,0) As [AreaSqKm]
from electorates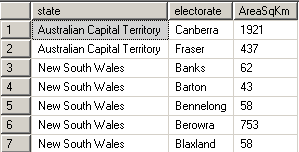
select  state
 , electorate
 , COUNT(p.Title) AS [NumberOfPostcodes]
 ,   ROUND(e.Location.STArea()/1000000,0) AS [AreaSqKms]
 ,   ROUND(e.Location.STArea()/1000000 /COUNT(p.Title),0) AS [AreaPerPostcodeSqKm]
from electorates e
inner join Postcodes p on (p.Location.STIntersects(e.Location) = 1)
group by State, electorate, e.Location.STArea()/1000000
select  state
 , e.electorate
 , p.Title as [Suburb]
 ,   COUNT(pp.PollingPlaceID) AS NumberPollingPlaces
from electorates e
inner join Postcodes p on (p.Location.STIntersects(e.Location) = 1)
inner join PollingPlaces pp on (pp.Electorate = e.Electorate AND pp.Postcode = p.Postcode)
group by state, e.electorate, p.Title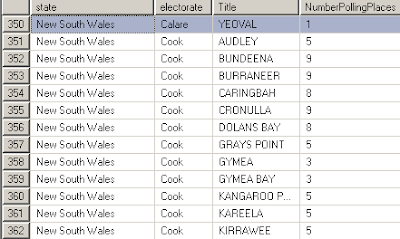
select  state
 , e.electorate
 ,   ROUND(e.Location.STArea(),0) AS [AreaSqMs]
 ,   SUM(ppv.TotalVotes) AS [TotalVotes]
 ,   ROUND(e.Location.STArea() /(1+SUM(ppv.TotalVotes)),0) AS [AreaPerVoterM]
from electorates e
inner join Postcodes p
on (p.Location.STIntersects(e.Location) = 1)
inner join PollingPlaces pp
  inner join PollingPlaceVotes ppv on ppv.PollingPlaceId = pp.PollingPlaceId
 on (pp.Electorate = e.Electorate AND pp.Postcode = p.Postcode)
group by State, e.electorate, e.Location.STArea()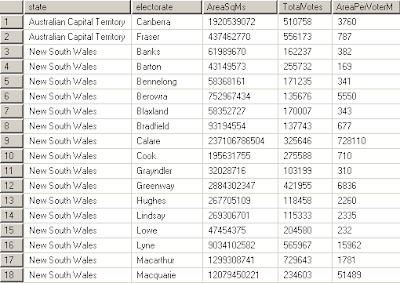
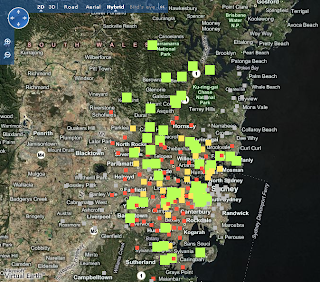
It is this query I've attempted to map at the top of the post - hopefully demonstrating finding points inside a polygon to group postcode data together for couting and summation; and using the area function to determine 'density'.
The next step is to get the POLYGON data into a map (as well as the POINTS)...
select electorate, Location.STAsText() as PolygonWKT
from electorates order by electorate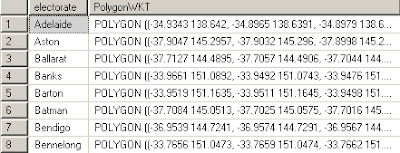
No comments:
Post a Comment
Note: only a member of this blog may post a comment.