Tuesday, 29 April 2008

IMG - big company, worst website ever

IMG eCommerce is a part of IMG, "the world's premier and most diversified sports, entertainment and media company"... too bad all that money can't do any better than produce a product like clubsONLINE, the worse website ever.

Think I'm exaggerating? Here are some screenshots from their 'online payment wizard'...

Let's start with a pretty simple form... it's not just the layout that is screwed up... how about allowing the 'Enter' key to submit the form (maybe a visual indicator on the button too); and what does that red diamond mean?


Ever heard of radiobuttons; even a DDLB would do. Is capitalization really important?


Hmmm, the "wizard"-type UI normally guides us through the steps. How about a hint on which button you'd like pressed?


Saving the best until "last" - you've GOT to be kidding. No, seriously, two buttons [Submit Payment] and [Payment]? Is one of these really meant to be 'cancel' or 'back'?


I 'transact' quite a bit on the web - and this is the first time since about 1994 that I can recall a payment process quite so unwieldy!

Wednesday, 2 April 2008

Loose Xaml (WPF and data binding)

Inspired by a no-longer-working (?) demo of Avalon Xaml (from 2004/05) by Joe Marini, I've put together this Loose Xaml sample blog reader with an RSS.XML feed from this blog.

It works in a browser, if you download the files (Xaml & rss) and run locally, or just check the screenshot:


The code is only 43 lines of markup (with breaks for readability!) - no C# or VB in sight.

I think exercises like this serve two purposes:

Firstly, helps to understand the databinding concepts in WPF
  <Canvas.Resources>
<XmlDataProvider x:Key="NewsData" Source="rss.xml" XPath="rss/channel" />
</Canvas.Resources>
<Canvas.DataContext>
<Binding Source="NewsData" XPath="rss/channel" />
</Canvas.DataContext>
also
Text="{Binding Source={StaticResource NewsData},XPath=description}"
and
    <StackPanel Margin="5" Width="500"
DataContext="{Binding ElementName=NewsList,Path=SelectedItem}">
<TextBlock DockPanel.Dock="Top" Text="Article Description:"/>
<TextBlock Margin="10" TextWrapping="Wrap" Name="SelectedItemDetails"
Text="{Binding XPath=description}" />
</StackPanel>
Secondly, helps structure your thinking around a UI that sits atop 'data services'
Quite a lot can be accomplished with Xaml markup - I think it would be interesting to see just how complex an 'application' could be created in a single Xaml file, using only databinding (and whatever server-side services you needed). WCF/REST could play a role (Syndication services... where's that link?).

The sandbox that loose Xaml sits in does present some problems... you can only load files from the origin, so no referencing RSS feeds from other servers. A middle-man pass-through (or other side-step) could get around that, however. It would seem trivial to create a fairly neat Gmail (or other service) reader; basically anything that publishes RSS (or any Xml, really). What is not clear to me just yet is whether it would be do-able to write a complete mail client, for example, following the same principles...


p.s. It's interesting to see how the databinding syntax changed, from "*Bind(XPath=author)" to "{Binding XPath=description}". Notice also how
TextContentText
XmlDataSourceXmlDataProvider
IDName
FlowPanelFlowDocument (?)
TextTextBlock
I think it's kinda cool to see the tools evolve like that - same now with Silverlight...

UPDATE: If you are wanting to use a datasource from ASMX or SVC, this post on XmlNamespaceManager will be useful. Once you start adding namespaces, the SelectedItem method I've used will break, and you'll want to read this post explaining the intricacies of {Binding} to Xml and the selected item.

Tuesday, 25 March 2008

DeepZoom in Silverlight 1.0 (part deux)

One of the 'issues' I found with using DeepZoom output in Silverlight 1.0 was the irregular shape of DeepZoom Composer's (Mermaid) output -- the entire 'image' is not square, nor are the right/bottom edge tiles.

These two simple examples shows how 'Mermaid' thinks: it will fill up tiles from top-left, leaving the bottom-right tiles "just" big enough to encapsulate the source image.


That's fine for Silverlight 2.0 MultiScaleImage controls to work with, since it can 'cheat' during layout, using the data in info.bin/info.xml to figure out how many Image controls to dynamically create.


But for a basic tile-client (of the sort that can easily display map tiles) that expects the source data to be a perfect square, the basic 'Mermaid' output is "too efficient".

Enter the MakeSquare console application...

It needs a little bit of 'tuning' (the "base" zoom level is hardcoded), but it basically walks a DeepZoom Composer output directory and
  1. makes all tiles square
  2. fills in missing tiles to make each 'zoom level' square
like this basic example (currently working best in Firefox :-s )...

Wednesday, 19 March 2008

DeepZoom "Publisher"

Firstly, a quick note about hosting Silverlight 2.0 on 'locked down' hosting providers (ie. where you can't set the MIME type for the .xap extension to application/x-silverlight-app) and you follow the advice to change the extension to .zip... it doesn't seem to work when your Silverlight 2.0 application uses DeepZoom/MultiScaleImage! I can't explain why, but my DeepZoom test doesn't work (currently; request is in to set the MIME types) even when Tim's test page does (on my server).

Anyway, until my hosting provider fixes the server, here's what this page should look like:


which of course pans/zooms with a little help from Scott Hanselman and the Expression team blog


Pretty easy to do with the DeepZoom Composer, but even easier with a little program that takes an Adobe Acrobat/PDF file and generates everything for you!


You'll need the following:and you will get a complete MultiScaleImage 'set' (info.bin, info.xml and a whole piled of numbered directories). Check Scott H and the Expression team posts on wiring it up.


UPDATE (20-Mar): now that my hosting provider has added the .XAP extension, the demo works. To 'prove' that renaming to .ZIP fails when using MultiScaleImage, this is an identical page with .XAP renamed to .ZIP, both in the object tag and the file itself (obviously).

Thursday, 13 March 2008

DeepZoom in Silverlight 1.0

DeepZoom (ex-SeaDragon) is a very cool 'application' of the image-tiling concept used in online maps like google and live maps/virtual earth.

There are (well, seem to be) two 'modes' for DeepZoom: with or without a 'Collection'; where 'Collection' seems to mean each element of the image has it's own set of tiles and can be treated individually.

It is the 'Collection' mode that allows the Hard Rock Cafe Memorabilia to slide images around when you choose different categories (by artist, type, decade, genre, location). When a 'Deep Zoom Collection' is created, each element has it's own folder within which the tiles are grouped by zoom level. It's easy to conceptualise how this model will 'scale up' to PhotoSynth where each element exists not just in a 2D space but in a 3D space with corresponding 3D positioning (but with the same basic metadata that supports DeepZoom Collections now) residing in the info.bin/info.xml files. Of course building the 'composer' for PhotoSynth will be orders of magnitude more difficult :)

Anyway, back to DeepZoom... when you do NOT generate a collection,

DeepZoom Composer (Mermaid) generates the ENTIRE SCENE in a single set of zoom-level-grouped images... awfully similar to the way map tiles are cut, and this is where it gets interesting!

If you already have (coincidentally) a Silverlight 1.0 "Tile Client" and map browser running, it would be a simple matter to change your google topographic image location template (for example) from
var gridPos = quadkey.charAt(quadkey.length-1);
var t = new Tile(quadkey, WORLD.Zoom)
var nz = 17 - WORLD.Zoom;
imageUrl = 'http://mt'+gridPos+'.google.com/mt?n=404&v=w2p.63&x='
+t.Column+'&y='+t.Row+'&zoom='+nz+'';
to
var nz = 9 + WORLD.Zoom; // DeepZoom idiosyncrasy
imageUrl = '/ClientBin/DeepZoomMags/'+nz+'/'
+t.Column+'_'+t.Row+'.jpg';
and be able to navigate a DeepZoom image using Silverlight 1.0!

This example is NOT live on the web (for now), screenshots follow to prove it works:


Just to tie this back to Geoquery 2008, the same Tile Client code exists in C#/WPF so it would also be trivial to modify the configurable MapSources.xml to browse a DeepZoom (NON-Collection) image from a WPF application...

NOTE: there are known issues with this approach, including DeepZoom Composer not generating a perfect 'square' of source images, and trimming 'edge' images to the size they need to be rather than 'squares' (causing stretching on the right & bottom edges). Both would be simple to cater for in a purpose-built Silverlight 1.0 DeepZoom viewer.

Tuesday, 4 March 2008

Geoquery 2008 v0.72

Another minor release of Geoquery 2008 to finish off some of the 'known bugs' around line and polygon rendering... It can be downloaded here.

First up, Morten has helped fix a number of bugs in Geoquery, and this release is no exception. While trying out his OGC conformance test map I discovered some GEOMETRY idiosyncrasies I still hadn't fixed. If you read his post and download the schema/data, this sql works best in Geoquery.


Morten also pointed out the issue with holes... (notice how the GEOGRAPHY instance is rendered on both the Shape & Map tabs!)


And finally, after a month away from the code (some of it at the beach :) it was relatively quick to solve most of the problems around 'wrapping': with a bit more help from Ed Williams I was able to discard my previous efforts (using the SqlTypes) and solve the problem with some basic math - hoorah!


I expect it will be a bit of a wait for the next version of this code. I have a lot of ideas to incorporate, some of which require further architectural changes. I will also update the Examples to discuss the new features in CTP6. Until then - enjoy Geoquerying...

Monday, 3 March 2008

Back to "work" on Geoquery

After a great holiday at the beach, a rushed implementation of PayPal, some silverlight prototyping and fighting with IL at work, I've finally found some time to work on Geoquery again.

v0.8 is pretty ambitious, so it's likely to be an interim version that fixes a few more bugs, such as polygons that cross +/- 180 degrees Longitude.


and Geography displayed on the Shapes tab


and the dodgy example from my last post


Still a little more to do (what about when the polygon disappears above +/-85 degrees Latitude), but hopefully I'll be back working on street-level maps 'any time now'.


p.s. yeah, I went to the "2008 launch wave". What I don't get is when headlines that look like {data binding} became cool marketing?

Thursday, 28 February 2008

WCF Web Services - Serialization of Automatic Properties

After attending the Heroes Happen {2008} event, I put together a little 'web services comparison' quick comparison as a "proof of concept" for my team at work.
The basic premise was to show an ASP.NET page using the AJAX ScriptManager consuming JSON objects served by both 'traditional' ASMX web services and Windows Communication Foundation (.SVC) web services in client-side Javascript. Creating JSON-enabled WCF services in .NET 3.5 was very helpful in getting it working quickly.

It was a pretty simple example - summarised in this graphic:


I built then ASMX first, then "ported" the resulting code to WCF. Everything worked pretty much as expected, until I got to the Javascript objects that WCF sent to the client. The objects seemed to load OK, but none of the fields/properties that I expected were present! At first I couldn't figure out what the problem could be - here's a look at the C# class definition - can you see the problem?


The same underlying C# class was being used in both ASMX & WCF, so it was difficult to imagine why ASMX worked and WCF didn't. Confused, I stepped into the Javascript using Firebug... at first, it wasn't immediately obvious to me why the properties had become <Code>k__BackingField, <Id>k__BackingField, etc in Javascript.


Footheory's post on Automatic Properties jogged my memory on how the compiler 'deals with' Automatic Properties... so the WCF JSON serializer is (for some reason) emitting the underlying field names whereas ASMX seems quite happy to emit the 'intended' name.

The fix was simple - add the WCF-specific DataMember attribute to the properties...

...and voila! they are again emitted in JSON as Code, Id, Price, etc.

It's probably easy to track down (now that Microsoft has made the source-code available) why this is happening; but for now I'm just happy it was an easy (if slightly unintuitive) fix. If you are converting ASMX web services to WCF and find BackingField popping up unexpectedly in your classes, adding the DataMember and DataContract attributes might just restore your sanity.


EDIT 7-May-08: I haven't gotten around to adding a Silverlight 2.0 example, but the concepts are all covered in Tim Heuer's Making use of your JSON data in Silverlight post.

Thursday, 31 January 2008

Geoquery 2008 v0.71 (oops)

Geoquery 0.7 has been quickly updated to 0.71 to fix the bug from yesterday.

It was while I was describing the problem that I was reminded how confusing it is for users when something "fails silently".

Imagine if the a "File-Save" function didn't report an error when your latest masterpiece couldn't be saved... you'd close the application and expect the data to be available next time - but it would be gone... forever! I strongly discourage rampant use of try{}catch{} in C# because it often (inadvertently) leads to silent failures.

By drawing the polygons on the Map & Sphere, but drawing them incorrectly, Geoquery was giving the impression that it was working when it wasn't. OK, probably not as severe as losing a file, but confusing nevertheless. It seemed important enough to fix and update (even though just a day earlier I'd decided it was "good enough for now").

So now the polygons are drawn correctly, and when they can't be (across +/-180° longitude), it "fails loudly" :)
SELECT geography::STGeomFromText(
'POLYGON((-33.9 151.12, 0 -118.4, 33.8 -118.4,-33.9 151.12))', 4326
), 'Red' as color, '#33ff0000' as Fill


P.S. a couple of other issues were also fixed, thanks Morten!

Wednesday, 30 January 2008

Geoquery 2008 beta - polygons on sphere NOT!

The releast notes for the latest Geoquery beta release should state in BIG BOLD LETTERS that the POLYGON GEOGRAPHY is not correctly rendered. I knew this but rushed the release out regardless - but this MSDN Forums post reminded me how confusing this can be so I wanted to be sure people use LINESTRING for now.

To illustrate, the poster wants to know why these polygons don't BOTH STIntersect 'Vancouver'...
DECLARE @myPoint geography, @polySmall geography, @polyBIG geography
SET @myPoint = geography::Parse('POINT(49.274138 -123.098562)')
SET @polySmall = geography::Parse('POLYGON((47.0 -124.0, 47.0 -122.0, 50.0 -122.0, 50.0 -124.0, 47.0 -124.0))')
SET @polyBIG = geography::Parse('POLYGON((47.0 -155.0, 47.0 -85.0, 50.0 -85.0, 50.0 -155.0, 47.0 -155.0))')
SELECT @polySmall.STIntersects(@myPoint) AS Intersect_polySmall, @polyBIG.STIntersects(@myPoint) AS Intersect_polyBIG
SELECT @polyBIG , 'Red' as Color, '#44ff0000' as fill
SELECT @polySmall, 'Green' as Color, '#4400ff00' as fill
SELECT @myPoint, 'Blue' as Color, 2 as Thickness
because he's visualizing the shapes looking like this:
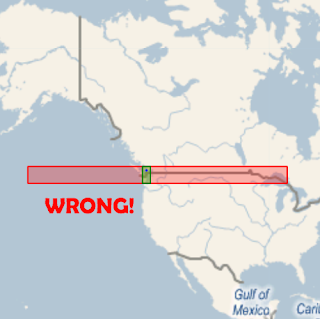
This is WRONG WRONG WRONG because Geoquery is not correctly rendering POLYGONs on the curvature of the Earth's surface... so you THINK they should intersect, but STIntersects() correctly returns false.

If we use LINESTRINGs to do the drawing (which Geoquery 2008 v0.7 DOES support) then it's rendered correctly and you can see that they don't overlap:
/* However converting to a LINESTRING which is rendered correctly, it's clear they don't intersect*/
DECLARE @myPoint geography, @polySmall geography, @polyBIG geography
SET @myPoint = geography::Parse('POINT(49.274138 -123.098562)')
SET @polySmall = geography::Parse('LINESTRING(47.0 -124.0, 47.0 -122.0, 50.0 -122.0, 50.0 -124.0, 47.0 -124.0)')
SET @polyBIG = geography::Parse('LINESTRING(47.0 -155.0, 47.0 -85.0, 50.0 -85.0, 50.0 -155.0, 47.0 -155.0)')
SELECT @polySmall, 'Green' as Color, '#4400ff00' as fill
SELECT @polyBIG, 'Red' as Color, '#44ff0000' as fill
SELECT @myPoint, 'Blue' as Color, 2 as Thickness
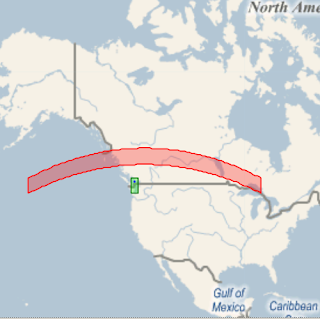

Even more interesting - the lines that should be parallel ARE, and the lines that shouldn't be (longitude) AREN'T, when drawn on a globe (as they should be).
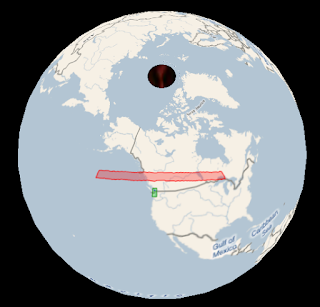

p.s. if you're wondering why LINESTRING works and POLYGON doesn't; it was (fairly) trivial to handle lines that 'break' over the +/-180 longitude (~international date line), but less so to 'split' POLYGONs into parts to draw independently ... so I left it out (for now). Sorry 'bout that.

UPDATE 31-Jan: this has been fixed and Geoquery 2008 v0.71 is available for download

Tuesday, 29 January 2008

Geoquery 2008 v0.7 (beta) available for "testing"

The latest version of Geoquery, v0.7, is available for download. Unfortunately it was a bit of a rush to get it out, so I haven't updated all the instructions - hopefully you'll get the hang of it.

Obligatory screenshot:

Monday, 28 January 2008

STIntersects=true; STIntersection=null ??

Not really sure whether this is a 'bug' or me not just 'getting' the single-hemisphere restriction, but sometimes when STIntersects returns true, STIntersection returns null.

I first noticed it when 'drawing' LINESTRINGs across the 'international date line' (longitude=180) which is where the default map edges are -- the "line" from Sydney to Los Angeles necessarily crosses this boundary.
DECLARE @idl geography
DECLARE @idlSouth geography
DECLARE @SYDtoEquator geography
DECLARE @SYDtoLAX geography

SET @idl = geography::STGeomFromText('LINESTRING(85 180, -85 180)',4326);
SET @idlSouth = geography::STGeomFromText('LINESTRING(0 180, -85 180)',4326);
SET @SYDtoEquator = geography::STGeomFromText('LINESTRING(-33.9 151.12, 0 -118.4)', 4326);
SET @SYDtoLAX = geography::STGeomFromText('LINESTRING(-33.9 151.12, 33.8 -118.4)', 4326);

SELECT @SYDtoEquator.STIntersects(@idl) as [Intersects]
, @SYDtoEquator.STIntersection(@idl) as [Intersection]
, @SYDtoEquator, 'Sydney to Equator' as [Desc]
, 'why is Intersection null?' as [Question]
SELECT @SYDtoLAX.STIntersects(@idl) as [Intersects]
, @SYDtoLAX.STIntersection(@idl) as [Intersection]
, @SYDtoLAX , 'Sydney to LAX' as [Desc]
/* shortening the 'idl' line 'fixes' it */
SELECT @SYDtoEquator.STIntersects(@idlSouth) as [Intersects]
, @SYDtoEquator.STIntersection(@idlSouth ) as [Intersection]
, @SYDtoEquator, 'Sydney to Equator' as [Desc]
SELECT @SYDtoLAX.STIntersects(@idlSouth) as [Intersects]
, @SYDtoLAX.STIntersection(@idlSouth) as [Intersection]
, @SYDtoLAX, 'Sydney to LAX' as [Desc]
This is the result "set"


And this is how the lines "should look"


As the line endpoint changes, so does the STIntersection result (although STIntersects returns true every time)
@SYDtoEquator = geography::STGeomFromText
('LINESTRING(-33.9 151.12, 10 -118.4)', 4326); -- NULL
@SYDtoEquator = geography::STGeomFromText
('LINESTRING(-33.9 151.12, 20 -118.4)', 4326); -- NULL
@SYDtoEquator = geography::STGeomFromText
('LINESTRING(-33.9 151.12, 30 -118.4)', 4326); -- GOOD
@SYDtoEquator = geography::STGeomFromText
('LINESTRING(-33.9 151.12, 40 -118.4)', 4326); -- GOOD
@SYDtoEquator = geography::STGeomFromText
('LINESTRING(-33.9 151.12, 50 -118.4)', 4326); -- NULL

So... any thoughts why some of these 'succeed' while others fail?

Thursday, 24 January 2008

Spatial queries: not just for Earth

No idea what real applications this might have, but it was kinda fun:
/* http://www.fi.edu/pieces/schutte/landchart.html */
select -- Apollo landings
geography::STGeomFromText('POINT(0.67 23.49)', 4326)--1
, geography::STGeomFromText('POINT(-2.94 -23.45)', 4326)--2
, geography::STGeomFromText('POINT(-3.67 -17.46)', 4326)--14
, geography::STGeomFromText('POINT(26.11 3.66)', 4326)--15
, geography::STGeomFromText('POINT(-8.6 15.31)', 4326)--16
, geography::STGeomFromText('POINT(20.17 30.8)', 4326)--17
, 15.0 AS [Thickness], '#770000ff' AS [Color]


The map data in Geoquery is in a configurable Xml file - MapSources.xml so it's relatively simple to include different tile servers for Earth images (as well as the Moon & Mars)!

Friday, 18 January 2008

geography:STBuffer() IS 'straight'

It can be difficult to visualize "geographic" straight lines (intersections, overlaps, etc) on a 'flat' projection, so here's a set of STBuffers over the LAX-JFK line... it doesn't "look" straight until you see it on a globe:


Using the 'special columns' feature of Geoquery (and a different map...)
DECLARE @g GEOGRAPHY
SET @g = geography::STGeomFromText('LINESTRING(33 -118, 40 -73)', 4326);
SELECT @g, 'Blue' AS [COLOR], 2 AS [Thickness]
UNION ALL SELECT @g.STBuffer(450000), 'Blue' as [COLOR], 1 AS [Thickness]
UNION ALL SELECT @g.STBuffer(1500000), 'Green' as [COLOR], 1 AS [Thickness]
UNION ALL SELECT @g.STBuffer(3000000), 'Purple' as [COLOR], 1 AS [Thickness]
UNION ALL SELECT @g.STBuffer(4000000), 'Orange' as [COLOR], 1 AS [Thickness]

Thursday, 17 January 2008

Geoquery: when a straight line isn't straight...

I was already aware that straight lines on a sphere (aren't really straight), but had left the correct handling of such matters out of Geoquery 0.6.

Unfortunately, this made it look rather incomplete; simply drawing a straight line over a projected map...

...isn't quite right

There are quite a few references for how to calculate the 'correct line' - I liked Ed Williams Aviation Formulary - and finally got around to giving it a try.

Here is how the query (and result) should look; with a couple of extra STBuffers thrown in...
DECLARE @g geography;
-- LAX 33°57 -118°24
-- JFK 40°38 -73°47

SET @g = geography::STGeomFromText(
'LINESTRING(33 -118, 40 -73)', 4326);
SELECT @g, null,null,null, 'Blue' as [COLOR]
UNION ALL
SELECT @g.STBuffer(450000), @g.STBuffer(1500000), @g.STBuffer(3000000), @g.STBuffer(4000000), 'Orange' as [COLOR]


The interesting thing about this canvas is the 'straight line' was the only element that I needed to programmatically 'project' -- Katmai's spatial support in the GEOGRAPHY::STBuffer() result is already a POLYGON whose points can be applied directly to the map-projection (ie. it isn't just described as two semicircular shapes joined by two parallel straight lines).

Geoquery can also correctly show buffers on points [aren't] circular on a projected map; the query from that link is reproduced below

DECLARE @g geography;
-- Copenhagen 55°37 12°39
SET @g = geography::STGeomFromText('POINT(55.55 12.66)', 4326);
SELECT @g, 'Blue' as [COLOR]
UNION ALL
SELECT @g.STBuffer(4000000), 'Purple' as [COLOR]


NOTE: Geoquery 2008 0.7 (which contains the enhancements described above) is NOT YET AVAILABLE for download. When it is available, it will also include the complete set of GEOGRAPHY Examples in addition to the GEOMETRY ones already available.

Wednesday, 16 January 2008

Geoquery 2008 v0.6 (beta)

Geoquery 2008 now supports the GEOGRAPHY datatype as well - displaying the results on a Virtual Earth map rather than a white shape canvas.


v0.6 also adds an Export... function so you can save spatial query results graphically, for emailing/reports/etc.


Here are a couple of Exported resultsets from the MSDN Sample queries...