Showing posts with label maps. Show all posts

Friday, 23 July 2010

Drawing on Maps with MonoTouch

iOS4 introduced new features like MKOverlay to help draw lines/routes and shapes/polygons on the MKMapView control, however it has always been possible to add these features to maps in iOS3.

Two (Objective-C) examples of displaying geometric shapes on MKMapView in iOS3 are:
...it is these examples that I've ported to MonoTouch (as a Universal app: iPhone and iPad). You can grab the code from github project MapStuff and see some screenshots below:

I put together a class diagram to try and explain how they work (the classes shown are from the 2nd example, which allows you to draw your own shape).

Please remember all the hard work here has been done by the original authors. All credit goes to them. Any bugs in the MonoTouch code are mine... let me know if you find any.

iOS4 examples to follow...

Sunday, 20 September 2009

Silverlight mapanimation

Taking a small break from MonoTouch to update RaceReplay.net.

Click to view each image


or if you already have Silverlight, watch the animations of today's Sydney Running Festival
Missing MonoTouch?
To get your MonoTouch fix for the day, I recommend the following screencasts by Brent Schooley:Highly recommended.

Wednesday, 12 August 2009

City2Surf 2009 on RaceReplay.net with Flickr

The world's "largest timed footrace" - Sydney's City2Surf - is now viewable on RaceReplay.net thanks to Silverlight and BingMaps.

There are two 'new' features:

1) Flickr photo integration (try it)

Using the Flickr photo search API, the Silverlight client renders small pink-and-blue dots for photos that are both geo-tagged and tagged:"city2surf". Clicking on the dot will open the Flickr page.


2) Visualizing the entire race (try it)

It is (unfortunately) impossible to animate the 65,000 or so points that would represent every runner and walker taking part in the event. By aggregating the finishers into timebands (and using both size & opacity to represent 'value') you can get some idea of the distribution of participants over time, over the course.


Add yourself!

As always, you can search for and add more 'runners' to the animation. Start typing a name into the autocomplete box, select from the list (optionally choose a color from the color-picker) and click Add runner.

Tuesday, 12 May 2009

Draw on Silverlight Virtual Earth Map Control

There are a couple of different projects where I'd like to enable 'drawing' on a map (including RaceReplay.net) - this is a basic first-cut of drawing within the Microsoft VE Map Control.

Each click on the map will start/continue a line. The MouseLeave event is wired to start a 'new' line. Navigating the map (dragging/double-click zoom) also causes points to be drawn - obviously this needs some work...


The two files required to build it are Page.xaml and Page.xaml.cs, the key pieces of code being
private void VEMap_MouseLeftButtonDown(object sender, MouseButtonEventArgs e)
{
Map m = (Map)sender;
Location l = m.ViewportPointToLocation(e.GetPosition(m));
if (polyline == null)
CreateNewPolyline(l);
else
polyline.Locations.Add(l);
}
and
private void CreateNewPolyline(Location startPoint)
{
polyline = new MapPolyline();
polyline.Stroke = new SolidColorBrush(Colors.Red);
polyline.StrokeThickness = 2;
var lc = new LocationCollection();
lc.Add(startPoint);
polyline.Locations = lc;
VEMap.Children.Add(polyline);
}
Simple, eh?

p.s. these are plain old straight lines - at the 'continent' level you might expect them to curve as though on a great-circle; I'm not too worried about implementing that right now since the target usage of my drawing is at a much "smaller scale"... however Geoquery2008 does draw great circle lines correctly...

Saturday, 2 May 2009

Silverlight "Maps That Bend Upwards"

I was inspired today by HERE & THERE's horizonless projection of Manhattan (via The Map Room: Maps that Bend Upwards).

Using Silverlight 3.0 beta and it's new PlaneProjection feature, I have hooked up three Silverlight Map Controls with different values for RotationX, GlobalOffsetY (vertical displacement) and GlobalOffsetZ (in/out of the page) to create a very crude 'interactive' version of their horizonless-map.

If you have Silverlight 3.0 beta installed, you can try out the Silverlight Virtual Earth Maps That Bend Upwards OR if you don't have the beta installed, you can watch a screencast.


[try it] [watch it]

I've noticed a little bit of weird behaviour on loading (sometimes the 'initial' map of New York doesn't load completely sync'd in all three panels), but after that it seems to work OK - it's just for fun after all.

Tuesday, 7 April 2009

Polyline.StrokeLineJoin and tight corners

Sharp corners in Polylines (particularly thick ones) can create unintended artefacts - particularly apparent when converting a (somewhat shaky) GPS track into a line on the Silverlight VE Map Control.

In this screenshot the circled 'line extension' (leading off into the water) is not actually part of the path, but an artefact of a very tight corner:


A few simple additions - StrokeLineJoin being the most important - and the Path looks "correct":

<m:MapPolyline
Stroke="Blue" StrokeThickness="10" x:Name="Course"
StrokeLineJoin="Round"
StrokeEndLineCap="Round"
StrokeStartLineCap="Round"

Locations="-33.84780366140732,151.21159315109253 -33.84504135759562,151.2111210823059 -33.84418591636912,151.2106704711914 -33.84374037067171,151.21082067489624...
/>


Just something to be aware of...

Monday, 6 April 2009

Silverlight VirtualEarth Map Control - with video

Okay - I wasn't going to do any more Silverlight VE Map Control posts... this is definitely the last one! I found some videos on YouTube that I thought suited 'animating' a map so I gave it a try. These would work MUCH BETTER if I had Silverlight-encoded videos that I could sync to/control more easily: but you get the idea...

Sydney City2Surf


Sydney Marathon


p.s. YES I know it's dodgy to have to 'sync' the start of each element manually - but without lots of hassle figuring out if the YouTube video is loaded and running it was the easiest way to proof-of-concept...

Wednesday, 1 April 2009

Silverlight VirtualEarth Map Control - with animation MkII

In recent posts I was working to get the new Virtual Earth Silverlight Map Control (CTP) to:
  1. display (pan/zoom) an <Image> overlay

  2. display (pan/zoom) a <Path> line

  3. animate a set of <Ellipse>s that also (pan/zoom)

  4. animate the map center point to 'track' an <Ellipse>

Turns out this was all possible - there are two examples: New York Marathon and Sydney Half Marathon

Each problem was overcome as follows:

1. Use m:MapLayer.MapRectangle not Height/Width

Any "pixel-specific" measurements applied to the Image will intefere with your Map layout. DO NOT specify Height, Width, Canvas.Left, Canvas.Top - just give the NW and SE corners (latitude,longitude) of the geographic region the image should cover, like this:
<Image Source="map.png" m:MapLayer.MapRectangle="40.8325608405556,-74.1015908473376,40.5722860972124,-73.843755459154"...

2. Use m:MapPolyline not Path

Although it was possible to keep the Path inside a Canvas element and place it with MapRectangle, it did not scale well since the Path Data is effectively tied to pixel coordinates. It is possible to write code to manually scale the line, but it was much easier to re-express the line with points specified by Latitude,Longitude in a m:MapPolyline like this:
<m:MapPolyline Stroke="Red" Locations="-33.863502543277534,151.20294570922852...

3. Use m:MapLayer.Position and a custom attached property

Positioning the Ellipses was easy using m:MapLayer.MapPosition, however animating this property was a little tricky. MapPosition is of Type Location but the Latitude and Longitude properties are not easily accessible as the TargetProperty of an animation, so I needed to write custom attached properties and set them as the target in code.
<Ellipse Fill="#FFFF0000" Width="11" Height="11" m:MapLayer.MapPosition="-33.863502543277534,151.20294570922852" m:MapLayer.MapPositionMethod="Center"...

4. Use m:Map.Center and a custom (hacked) attached property

Making the Map 'viewport' itself animate proved slightly trickier again. I created another attached property (code for all properties here) for some reason only one 'axis' (Longitude) would animate.

When I removed the Longitude property, then the Latitude position would animate... but I could not get them both animating together. Figuring it was a timing issue, rather than try to "set" both properties when they Changed, Latitude gets stuffed into a static field and then set in the LongitudeChanged handler - seems to work but not sure if it's a good idea (obviously it would break if you tried to animate two maps at the same time!)

More info on the final example - no more Map Control posts for a while...

Friday, 27 March 2009

Silverlight VirtualEarth Map Control - with animation

UPDATE: The Microsoft devs were right - it is possible (and not a bug). The 'complete' sample now keeps the image, course line and animated objects visible during all panning and zooming operations - try out
animation with Silverlight Virtual Earth Map Control!

I've made some progress with my first Silverlight Virtual Earth Map Control project...

Try it out (deprecated) latest

Here are some screenshots of the zoom/animation in action:


The code and xaml also online - I needed to (well, I think I needed to) use the ViewChangeEnd event to re-calculate various offsets and dimensions to keep the animation and overlay image sychronised with the Map Controls' zoom behaviour (even though panning worked without modification).

Sunday, 22 March 2009

Silverlight VirtualEarth Map Control - with DeepZoom Images

"TagUpdater" parses through your Deep Zoom metadata.xml, opens the images and reads EXIF title/description/tag data... so it was pretty simple to extend it to read latitude & longitude.

The location of each Deep Zoom sub-image is then available to display on a map, in the Tag Browser sample:


1. Metadata.xml entries now look like this
<Image>
<FileName>C:\Dev\Cities\bhutan_tigersnest.jpg</FileName>
<x>0</x>
<y>0.127264287334191</y>
<Width>0.199250151375691</Width>
<Height>0.203911475380207</Height>
<ZOrder>11</ZOrder>
<Tag>bhutan</Tag>
<Description>Amazing monastery perched on a cliff in Bhutan near Paro</Description>
<Rating>0</Rating>
<Title>Tiger's Nest</Title>
<LatLong>27.4266666666667,89.4033333333333</LatLong>
</Image>


2. We add a Silverlight VirtualEarth Map Control
xmlns:m="clr-namespace:Microsoft.VirtualEarth.MapControl;assembly=Microsoft.VirtualEarth.MapControl"
<m:Map x:Name="viewMap" Grid.Row="3" Height="220" Opacity="0.25" />


3. and in the code add a new MapLayer
MapLayer PinMapLayer = new MapLayer(); // Layer on map to 'add' stuff to [MAP]

viewMap.AddChild(PinMapLayer);


4. Then display the pins within the xmlClient_DownloadStringCompleted method (originally from Kirupa's sample)
//Now add to map [MAP]
if (latlongString != "")
{
var l = new Location(
Convert.ToDouble(latlongString.Split(',')[0])
, Convert.ToDouble(latlongString.Split(',')[1])
);
Image pin = new Image();
pin.Source = new BitmapImage(new Uri("blue_pushpin.png", UriKind.RelativeOrAbsolute));
pin.Stretch = Stretch.None;
var tooltipObject = new StackPanel();
var title = new TextBlock();
title.FontWeight = FontWeights.Bold;
title.Text = titleString;

tooltipObject.Children.Add(title);
var description = new TextBlock();
description.Text = descriptionString;
tooltipObject.Children.Add(description);

ToolTipService.SetToolTip(pin, tooltipObject);
// Adds the pushpin to the map layer.
PinMapLayer.AddChild(pin, l, PositionMethod.BottomCenter);
}


5. and in msi.MouseMove, move the map for the 'current' image
l = new Location(
Convert.ToDouble(imageMetadata[subImageIndex].LatLong.Split(',')[0])
, Convert.ToDouble(imageMetadata[subImageIndex].LatLong.Split(',')[1])
);
viewMap.Opacity = 1;
viewMap.SetView(l, 12);


If you play with it it will be obvious there are some useability issues with changing the map 'on hover' over the images (it's difficult to get the mouse over to the map if you want to navigate around), but the Silverlight VirtualEarth Map Control definitely makes it easy to build!

Saturday, 21 March 2009

Silverlight VirtualEarth Map Control - Search Results

Try out a basic search results view using the Silverlight VirtualEarth Map Control at searcharoo.net/SilverlightMap.html...

Searcharoo with Silverlight Map Control


Thanks to Chris Pietschmann's Tooltip example each pin shows what search result it refers too (although I still haven't figured out to make the pins 'click-able' to open the result link directly...).

The relevant code added to the search result JSON parsing:

1. Create a MapLayer
MapLayer PinMapLayer = new MapLayer();

2. Add it to the Map control first (ie. before adding Children)
ResultMap.AddChild(PinMapLayer);

3. Extract GPS location
var l = new Location(
Convert.ToDouble(result.gps.Split(',')[1])
, Convert.ToDouble(result.gps.Split(',')[0])
);


4. Create the pin (Image), add tooltip and add to MapLayer
Image pin = new Image();
pin.Source = new BitmapImage(new Uri("blue_pushpin.png", UriKind.RelativeOrAbsolute));
pin.Stretch = Stretch.None;

var tooltipObject = new StackPanel();
var title = new TextBlock();
title.FontWeight = FontWeights.Bold;
title.Text = result.name;
tooltipObject.Children.Add(title);
var description = new TextBlock();
description.Text = result.description;
tooltipObject.Children.Add(description);
ToolTipService.SetToolTip(pin, tooltipObject);

// Adds the pushpin to the map layer.
PinMapLayer.AddChild(pin, l, PositionMethod.BottomCenter);


The search box is pre-populated with manhattan which results in a set of photos.


Perform that search, then search for sydney to see how the VirtualEarth Silverlight Map Control animates between the two locations with nothing more than a simple call to SetView

ResultMap.SetView(GetMinMaxCenter(min, max), 12);

The complete code will be available on Searcharoo@Codeplex shortly.

p.s. another search to try is - pumpkin - geocoded photos are so cool!

Silverlight VirtualEarth Map Control - in "3D"

Further to my previous post on the Silverlight VirtualEarth Map Control - here it is in Silverlight 3.0 WARNING: will prompt to install Silverlight 3.0 - which is in BETA - do so at your own risk!


The animation and map styles (road|arial) work as you'd expect, but somehow it looks a lot cooler with this little bit of code added :-)

<Canvas.Projection>
<PlaneProjection RotationX="-60" />
</Canvas.Projection>


BTW, it seems to me like addition of 3D Projection (rather than a complete 3D environment, ala Kit3D and WPF) is the minimum they needed to add to get Photosynth working "natively" in Silverlight (instead of the current Silverlight-Photosynth beta which does use Kit3D)? ... hmmm ...

Friday, 20 March 2009

Silverlight VirtualEarth Map Control - initial impressions

Microsoft was bound to deprecate all the work on silverlightearth.com (and others on DeepEarth) at some point :D - and they've finally released a CTP of their efforts.

The control can be downloaded from Microsoft Connect: Silverlight Map Control - you have to register and fill in a survey first but then you're good to go. There is also a Getting Started guide to help, you know, get started.

It's actually pretty simple:
  • Add Reference to Microsoft.VirtualEarth.MapControl

  • Add namespace xmlns:m="clr-namespace:Microsoft.VirtualEarth.MapControl;assembly=Microsoft.VirtualEarth.MapControl"

  • and Xaml <m:Map x:Name="viewMap"/>

  • sprinkle a bit of C# (unnecessary, but why not)
    viewMap.View = new Microsoft.VirtualEarth.MapControl.MapViewSpecification(new Location(40.7199, -74.0030), 12.0000); //New York

and you've got a map!


Details

The control doesn't like being hosted on the filesystem (good old WebClient and ClientAccessPolicy restrictions I suppose) so when creating your first test project, remember to hook up a WebApplication as well...


otherwise you'll get the same error as the design surface does
Map loaded in unsupported URI scheme. Please reload page in http scheme.

but a WebApplication with an automatically created TestPage works just fine


Naturally I then wanted to apply it to something useful, so you can give this New York Marathon (2006) visualizer a go... in case it isn't obvious, it's showing how far behind the winner I was (and how far behind me Lance was :)
New York Marathon with Microsoft Virtual Earth Silverlight Control
I've blocked panning/zooming on it for now (until I figure out how to keep the animations and course in sync), but that is a bona-fide Microsoft Virtual Earth Silverlight Control (CTP) in there!
UPDATE [22-Mar]: I've updated the example so that dragging/panning works BUT zooming is still broken. I think I've copied the iSDK Add scalable element example exactly (but their Rectangle scales and my content doesn't). Weird...

The change was to move the 'animation canvas' inside the Map, like this:
<m:Map.Children>
<m:MapLayer>
<Canvas
m:MapLayer.MapRectangle="40.8325608405556,-74.1015908473376,40.5722860972124,-73.843755459154"
m:MapLayer.MapPositionMethod="Rectangle"
HorizontalAlignment="Stretch" VerticalAlignment="Stretch">


That didn't take long at all - so initial impressions are good. The map controls are very smooth and the basic stuff is intuitive to program around. In addition to the links above, you will want to play with the Interactive SDK and keep the SDK CHM handy until sample code starts appearing in the wild...

I wonder what the release date and go-live licensing details are???

Friday, 16 January 2009

Great Circles!

No, I'm not over-excited about a shape... Great Circles are a 'geographic concept' (via The Map Room).
A great circle is defined as any circle drawn on a globe (or other sphere) with a center that includes the center of the globe. Thus, a great circle divides the globe into two equal halves.
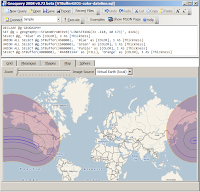
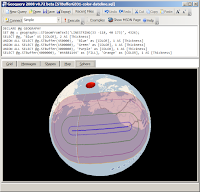
The post reminded me that some additional work on Geoquery 2008 is long overdue. Until then, it prompted me to blog my 'great circle drawing algorithm' as used in Geoquery 2008 to draw lines like this (a 'straight line' between two points, which looks curved on a Mercator projection but is clearly straight when viewed from above on a globe):

The above example uses SQL Server 2008's STBuffer() geography function - notice how the shaded area looks kidney-shaped on the 'flat' Mercator projection (the curve is more pronounced further north) but on the globe the sides are straight.

You can read the C# code to calculate a Great Circle arc or see it below. Given two System.Windows.Points on a Mercator grid (following the Virtual Earth 'scaling' pattern - notice the hardcoded zoomlevel 2 in the LatLongToPixel method calls) it will calculate a Great Circle between them and plot 10 points along that path (notice the hardcoded 0.1 in the for clause). It returns a System.Windows.Shapes.Polyline ready to draw!


It references Virtual Earth Tile System, and the algorithm itself is based on the work by Ed Williams on Aviation Formulary in particular calculating intermediate points on a great circle.

For those who are really paying attention, you may guess this isn't exactly the code used in Geoquery 2008... for a start 10 divisions was too coarse so Geoquery uses a variable number of points based on the length of the line and its proximity to the poles (where the 'curve' is more pronounced). Geoquery ALSO needs to stop/start drawing lines that cross Longitude 180° (so they wrap nicely on Mercator, and join when projected on a globe)... which is done by calculating the intersection of two great circles because SQL Server 2008 couldn't do it (but that's another story...)

P.S. there are some previous posts on the 'straight line' problem that might be an interesting read...

Saturday, 20 December 2008

Google Earth - New York in 3D

I promise to post something technical soon - but for now here's another OT post...

russ sent this news on the latest Google Earth update with New York in 3D. It looks awesome! Since I was only just in New York, I decided to compare a couple of photos with Google's rendering...

First, here's my photo from "Top of the Rock" at Rockefeller Center:

and Google's


And this is the view from the Westin on 43rd and 8th

and Google's (had to make a rough guess on the position of my window)


Can I have my city in 3D too now, please?


Sunday, 21 September 2008

SilverlightEarth updated for rc0

If you have been updating your Silverlight 2.0 beta 2 for Release Candidate 0, you will probably be familiar with this error "Failed to load the application. It was built with an obsolete version of Silverlight":

Even if your code is 100% RC0 'compatible', you need to re-compile your Silverlight assemblies with the RC0 Silverlight Tools for Visual Studio.

For example, SilverlightEarth.com/2 is updated for RC0, and SilverlightEarth.com/2b2 still hosts the beta2 bits. Although no code changes were required (or made), there a minor visual differences that I have yet to correct (the height of the radio-button StackPanels, for example).

SilverlightEarth.com hosting OpenStreetMap with the Google StreetView overlay

Slightly OT: GIS in XML blog posted recently about
Virtual Earth - DeepEarth - Deep Pockets. Basically it calculates a cost of approx. $1.25 per viewer if licensing Microsoft's Virtual Earth tiles for use in DeepEarth (Silverlight 2.0 map tile client)... although Microsoft can't be too concerned since they have it listed in their Community Gallery!

Luckily silverlightearth.com/2 offers OpenStreetMaps and NASA Blue Marble imagery...

Way OT: the Deep Zoom Tag Cloud example also updated for RC0

Monday, 18 August 2008

SilverlightEarth gets OpenStreetView, Hotmap layers

SilverlightEarth.com now has some additional map tile layers to view:OpenStreetMap with Google StreetView overlay


Hotmap overlaid on Virtual Earth

Tuesday, 24 June 2008

Silverlight(DeepZoom)Earth (beta 3)

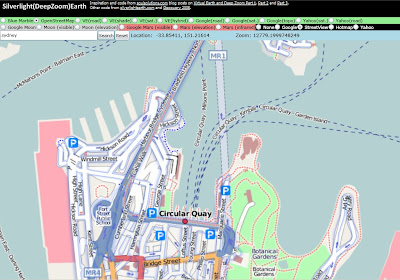
SilverlightEarth.com 2.0 beta (DeepZoom) now includes a new 'row' of functionality: latitude/longitude display, DeepZoom "zoom" factor display and a geocoding search:


It's not the most "full featured" search function - if zoom factor is less than '40' it will zoom to that level, otherwise it will preserve any higher 'power' of zoom. It might occasionally take you somewhere unexpected, as disambiguation isn't supported (yet).

You can also trigger a search from the querystring, so you can 'bookmark' a search, like this:

silverlightearth.com/2b2/?q=Golden Gate Bridge

or with zoom specified as well (note it's "DeepZoom Zoom Factor" and not your usual VE 1..18 range)

silverlightearth.com/2b2/?q=Seattle Space Needle&z=8000

"Reset" zooms back to the starting viewpoint. It seems I've broken the overlay with these changes - fix to come...

OT: this is one case where it's actually easier not to use DeepZoom - check out how much faster the Silverlight 1.0 version loads
silverlightearth.com/?q=Seattle Space Needle&z=16

UPDATE (25-Jun): Accepts both "Zoom Factor" AND "Tile Level"... if z < 18, z^2 is used as the "Zoom Factor", eg.
silverlightearth.com/?q=Sydney&z=16

Map selection is also supported from the URL, for example
silverlightearth.com/?q=Sydney&z=15&m=earthgt
The map 'codes' are backward compatible with Silverlight Earth 1.0.

Mapm=
Virtual Earth (road)earth
Virtual Earth (shade) earth2
Virtual Earth (satellite)earths
Virtual Earth (hybrid)earthh
Google (road) earthgr
Google (satellite) earthgs
Google (topo)earthgt
Yahoo (satellite)earthy
Blue Marbleearthbm
Moonmoon
Marsmars
The "q"uery can also be a simple latitude/longitude point, like this silverlightearth.com/2b2/?q=51.500151,-0.126236&z=12&m=earthg (or in SilverlightEarth 1.0).

Saturday, 14 June 2008

Silverlight(DeepZoom)Earth (beta 2)

After reading these posts on using new Silverlight 2.0 beta 2 Deep Zoom functionality to utilise external tile pyramids (such as Virtual Earth) I decided to give it a go...

The sample code was pretty complete, I just added the Geoquery MapSources, and away it goes...

silverlightearth.com/2b2 (requires Silverlight 2.0 beta 2)


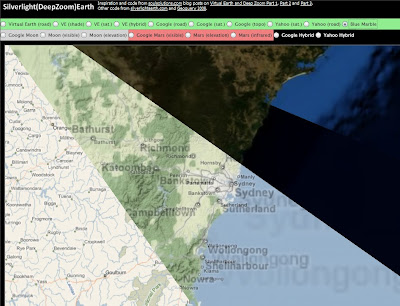
(screenshot a bit stylized to show the different map possibilities)

Okay, there's no searching/geocoding or other map niceties; and the DeepZoom shading (which works great for most things) is a little screwy on text-layers - you'll see what that means if you try it out. But it does work nicely, and puts my (still not finished) Silverlight 1.0 code to shame!

Tuesday, 11 December 2007

SQL Server 2008 (Katmai) Spatial/Geography Functions

Decided to take the 'night off' from SilverlightEarth.com to play with the new Geography types in the latest SQL Server 2008 CTP.

There is surprisingly little around in terms of demos and samples so far, John O'Brien's First Impression being the best by far (and uses Aussie data too!). Only took a few minute to get his postcode-data demo going in C# & WebDev Express 2008.

His code covers:
  • [geography] SQL Data Type
  • geography::STPointFromText(@WKT, 4326)
  • POLYGON (Well Known Text syntax)
  • geography::STPolyFromText(@WKTBounds, 4326)
  • STIntersects 'function'
  • SPATIAL INDEX on a column of type [geography]
and discusses the interesting 'side effect' of the datatype enforcing polygons not spanning greater than a hemisphere of area AND "Must be supplied in counter-clockwise order"! (the 4326 SRID is explained here)

This query over John's data:
SELECT Id, Postcode, Title, Location.STAsText()
FROM postcodes
returns the list of all the postcodes with 'human readable' co-ordinates, but that's about the only "interesting" thing you can do without adding other data...

So I visited the Google Election '07 site which has a link to http://voteaustralia.googlepages.com/aus.kmz that contains a 'collection' of polygons defining the electorates in Australia.

It was trivial to extract the data for just one electorate (Cook) using Excel to re-order (see counter-clockwise note above, and error below) and reformat the <coordinates> to fit in the following query:
DECLARE @g geography;
SET @g = geography::STGeomFromText('POLYGON((
-34.041 151.166,-34.036 151.178,-34.035 151.187,-34.037 151.195,
-- coordinates removed for clarity
-34.052 151.156,-34.044 151.162,-34.041 151.166))', 4326);

SELECT [Postcode] as Title
, [Title] as Description
, [Location].STAsText()
FROM [dbo].[Postcodes]
WHERE [Location].STIntersects(@g) = 1
Which returns the 31 postcodes in the Cook electorate, and
SELECT @g.STArea() -- square metres
which returns 195631.754900467 (square metres).

It shouldn't be hard to programmatically import the electorial boundaries to do more spatial queries; could also mash it up with aec polling place and voting population data (by postcode). Using the area and population we could do some density visualisation, and maybe some other useless calculations...

This is the error I got when I DIDN'T reverse the order of the coordinates from the KML file: localhost(MYPC\Administrator): Msg 6522, Level 16, State 1, Line 2
A .NET Framework error occurred during execution of user defined routine or aggregate 'geography':
Microsoft.SqlServer.Types.GLArgumentException: 24205: The specified input does not represent a valid geography instance because it exceeds a single hemisphere. Each geography instance must fit inside a single hemisphere. A common reason for this error is that a polygon has the wrong ring orientation.
Microsoft.SqlServer.Types.GLArgumentException:
at Microsoft.SqlServer.Types.GLNativeMethods.ThrowExceptionForHr(GL_HResult errorCode)
at Microsoft.SqlServer.Types.GLNativeMethods.GeodeticIsValid(GeometryData g)
- as explained above, you must ensure the POLYGON is described in counter-clockwise order!


Link drop:
geography Data Type Reference (Books Online)

Demystifying Spatial Support in SQL Server 2008 is an EXCELLENT 'real world' example.

SQL Server 2008 Katmai will Include Spatial Support is also good reading

And finally, this is a rather old (May) 'introduction' but still worth a look.


WOT: TODO in SilverlightEarth.com - FlashEarth mash-up